Race and Ethnicity
Race and Ethnicity
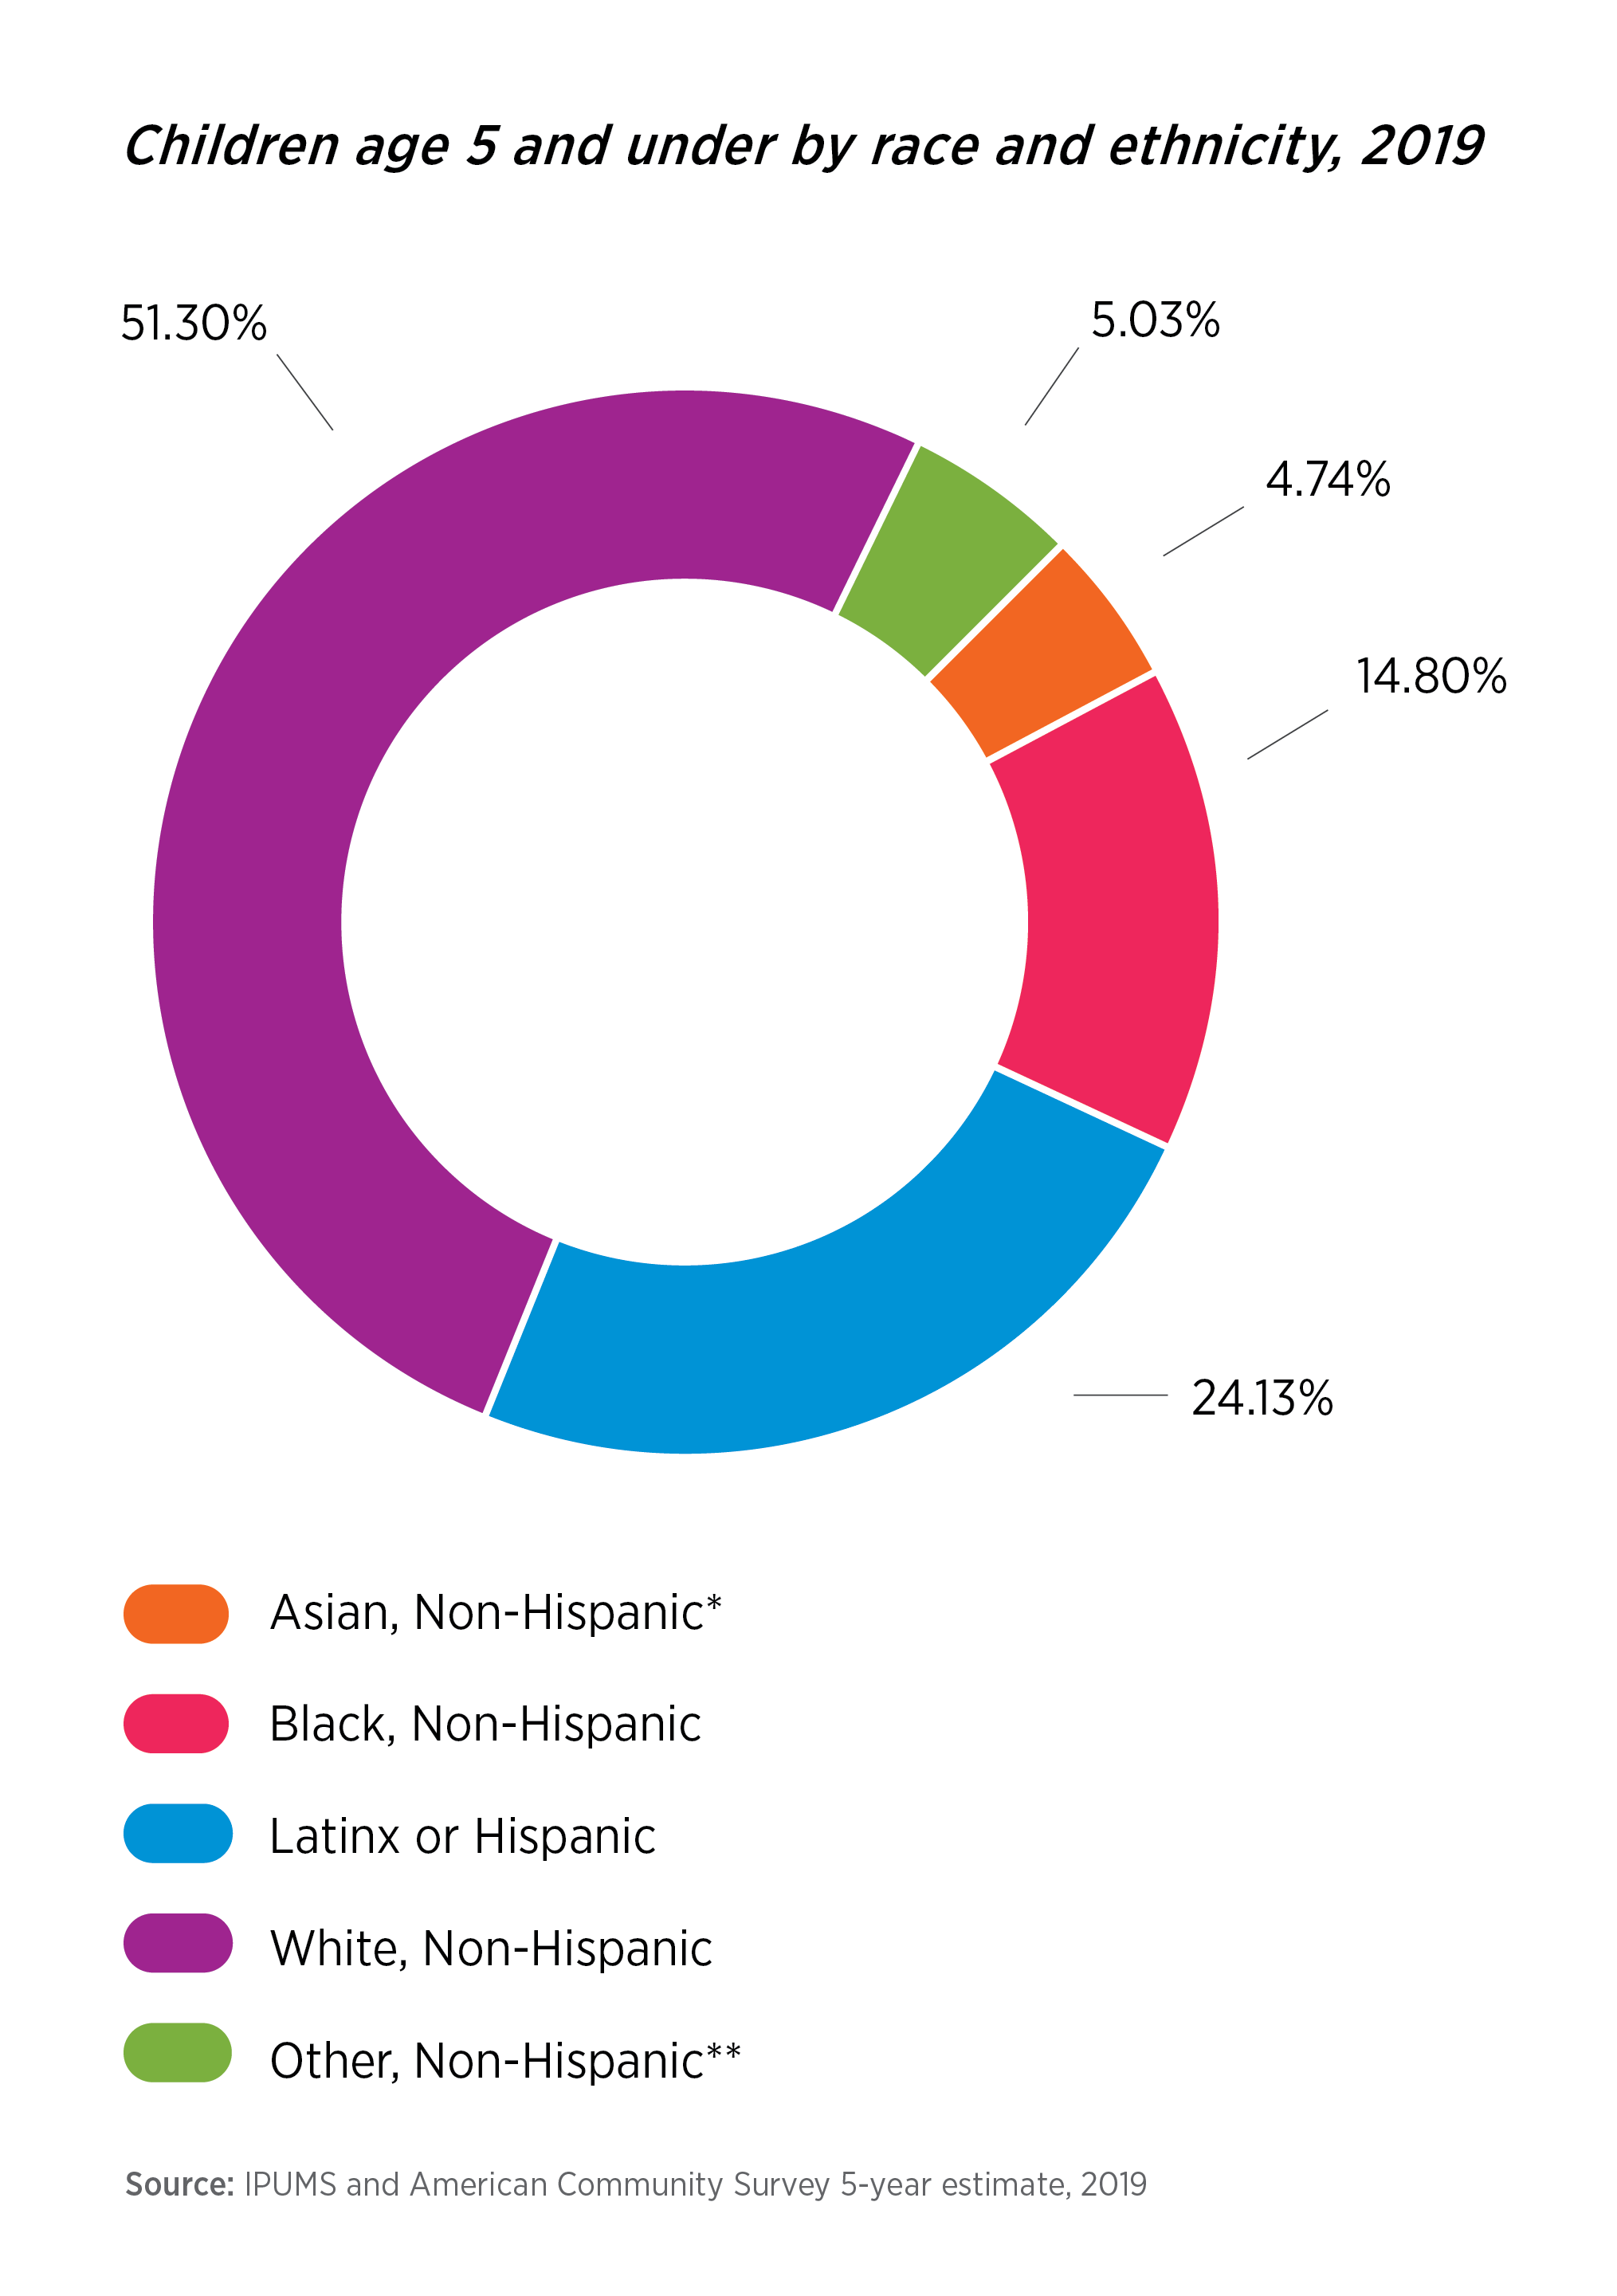
The PDF of the Illinois Risk and Reach Report contains, when available, state-level race and ethnicity data for each indicator. For this second edition of the Report, the Asian demographic was parsed out from the “Other, Non-Hispanic” category when available. “Other” includes Native American, Alaska Native, Native Hawaiian, Other Pacific Islander, and individuals identifying with Two or more Races.
The population of children age five and under, in Illinois, make up 7.23 percent (n= 916,880) of the state’s 12.67 million population. Below is a graph that disaggregates the data further.

Children age 5 and under in Illinois by race and ethnicity, 2019
See more race and ethnicity data by downloading the full Risk and Reach Report. Please fill out this form for the download link.
When data are disaggregated by race and ethnicity, the disparities are profound. It is critical to acknowledge that inequities in economic prosperity, the foundation necessary to establish stability and set the trajectory for the family and generations to follow, are grounded in systemic racism. The lasting effects of historically oppressive policies still permeate our systems as evidenced, for example, in the discriminatory practices in the housing and labor market. Improving access to family supports requires intentional approaches so that all children can have their basic needs met. Use the following racial equity questions to begin those intentional conversations.
Racial Equity Questions
Are all children served equitably? Who needs more support?
What data needs to be disaggregated (by race, gender, location, etc.) to understand if there are inequities/disparities?
What changes in existing policies, programs, budgets would reduce racial inequities?
What steps can ensure input from racial/ethnic groups experiencing risk to inform policy and program changes?